Send
Close Add comments:
(status displays here)
Got it! This site "www.robinsnyder.com" uses cookies. You consent to this by clicking on "Got it!" or by continuing to use this website. Note: This appears on each machine/browser from which this site is accessed.
R: Bar chart from XML
1. R: Bar chart from XML
This page looks at two typical ways in which XML data is represented.
Nodes with attribute values
Nodes with text values
For each, an R program is provided to use that XML data to create a bar chart.
The
XML package is required.
2. Install R package XML
R packages can be installed from R Studio or from the command line. Here is one way to install the R package
XML from the Windows command line using the default Windows installation path for R.
"C:\Program Files\R\R-4.0.4\bin\Rscript.exe" -e "install.packages('XML', repos='https://cran.rstudio.com/')"
The
repo parameter needs to be included and the single quotes need to be used inside the double quotes.
The path you use should include the installed version of R. The one here is
4.0.4.
3. Representing and processing count data
4. Nodes with attribute values
Here is the XML data to be read as nodes with attributes as name-value pairs.
<table>
<record name="a" value="59900"/>
<record name="b" value="11302"/>
<record name="c" value="14311"/>
<record name="d" value="34483"/>
<record name="e" value="95247"/>
<record name="f" value="17852"/>
<record name="g" value="13528"/>
<record name="h" value="62509"/>
<record name="i" value="46347"/>
<record name="j" value="2321"/>
<record name="k" value="4449"/>
<record name="l" value="25939"/>
<record name="m" value="19154"/>
<record name="n" value="51311"/>
<record name="o" value="54741"/>
<record name="p" value="9918"/>
<record name="q" value="183"/>
<record name="r" value="37468"/>
<record name="s" value="44630"/>
<record name="t" value="72396"/>
<record name="u" value="20651"/>
<record name="v" value="7458"/>
<record name="w" value="18376"/>
<record name="x" value="376"/>
<record name="y" value="14814"/>
<record name="z" value="234"/>
</table>
5. R code
Here is the R code [#1]
6. Code notes
The as.integer function is used to convert the xmlValues2 vector from character (as read from the data) to integer.
... more to be added ...
7. R output
Here is the output of the R code.
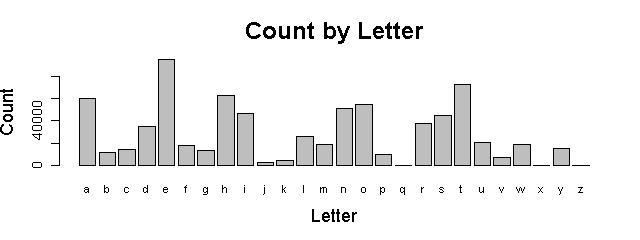
8. R chart
This is a simple bar chart for the present purposes. Future topics will cover how to make it look nicer.
Here is the chart produced by the R code.
9. Nodes with text values
Here is the XML data to be read as nodes with text values as name-value pairs.
<table>
<record><name>a</name><value>59900</value></record>
<record><name>b</name><value>11302</value></record>
<record><name>c</name><value>14311</value></record>
<record><name>d</name><value>34483</value></record>
<record><name>e</name><value>95247</value></record>
<record><name>f</name><value>17852</value></record>
<record><name>g</name><value>13528</value></record>
<record><name>h</name><value>62509</value></record>
<record><name>i</name><value>46347</value></record>
<record><name>j</name><value>2321</value></record>
<record><name>k</name><value>4449</value></record>
<record><name>l</name><value>25939</value></record>
<record><name>m</name><value>19154</value></record>
<record><name>n</name><value>51311</value></record>
<record><name>o</name><value>54741</value></record>
<record><name>p</name><value>9918</value></record>
<record><name>q</name><value>183</value></record>
<record><name>r</name><value>37468</value></record>
<record><name>s</name><value>44630</value></record>
<record><name>t</name><value>72396</value></record>
<record><name>u</name><value>20651</value></record>
<record><name>v</name><value>7458</value></record>
<record><name>w</name><value>18376</value></record>
<record><name>x</name><value>376</value></record>
<record><name>y</name><value>14814</value></record>
<record><name>z</name><value>234</value></record>
</table>
10. R code
Here is the R code [#2]
11. Code notes
The as.integer function is used to convert the xmlValues2 vector from character (as read from the data) to integer.
... more to be added ...
12. R output
Here is the output of the R code.
13. R chart
This is a simple bar chart for the present purposes. Future topics will cover how to make it look nicer.
Here is the chart produced by the R code.
14. End of page