Send
Close Add comments:
(status displays here)
Got it! This site "www.robinsnyder.com" uses cookies. You consent to this by clicking on "Got it!" or by continuing to use this website. Note: This appears on each machine/browser from which this site is accessed.
Python: Bar chart from JSON
1. Python: Bar chart from JSON
This page shows how to use Python to read in the data names with counts from JSON text files and make a simple bar chart.
2. Representing and processing count data
3. Imports used
The Python json library is used.
4. List of lists
Here is one possible JSON way to represent data as a list of lists.
[
["a",59900],
["b",11302],
["c",14311],
["d",34483],
["e",95247],
["f",17852],
["g",13528],
["h",62509],
["i",46347],
["j",2321],
["k",4449],
["l",25939],
["m",19154],
["n",51311],
["o",54741],
["p",9918],
["q",183],
["r",37468],
["s",44630],
["t",72396],
["u",20651],
["v",7458],
["w",18376],
["x",376],
["y",14814],
["z",234]
]
Here is the Python code to read the above JSON data file and output the results.
5. Program code
Here is the Python code [#2]
6. Output
Here is the output of the Python code.
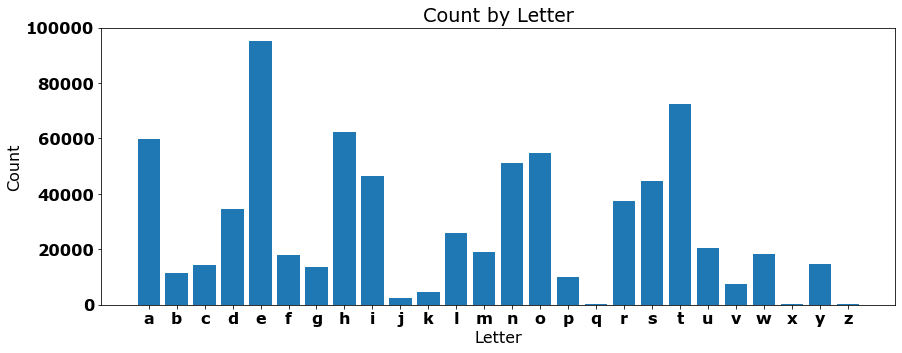
7. Chart
This is a simple bar chart for the present purposes. Future topics will cover how to make it look nicer.
8. List of dicts
Here is one possible JSON way to represent data as a list of dicts, each with a name-value pair.
[
{"name":"a", "value":59900},
{"name":"b", "value":11302},
{"name":"c", "value":14311},
{"name":"d", "value":34483},
{"name":"e", "value":95247},
{"name":"f", "value":17852},
{"name":"g", "value":13528},
{"name":"h", "value":62509},
{"name":"i", "value":46347},
{"name":"j", "value":2321},
{"name":"k", "value":4449},
{"name":"l", "value":25939},
{"name":"m", "value":19154},
{"name":"n", "value":51311},
{"name":"o", "value":54741},
{"name":"p", "value":9918},
{"name":"q", "value":183},
{"name":"r", "value":37468},
{"name":"s", "value":44630},
{"name":"t", "value":72396},
{"name":"u", "value":20651},
{"name":"v", "value":7458},
{"name":"w", "value":18376},
{"name":"x", "value":376},
{"name":"y", "value":14814},
{"name":"z", "value":234}
]
9. Program code
Here is the Python code to read the above JSON data file and output the results.
Here is the Python code [#3]
10. Output
Here is the output of the Python code.
11. Chart
This is a simple bar chart for the present purposes. Future topics will cover how to make it look nicer.

12. End of page