Send
Close Add comments:
(status displays here)
Got it! This site "www.robinsnyder.com" uses cookies. You consent to this by clicking on "Got it!" or by continuing to use this website. Note: This appears on each machine/browser from which this site is accessed.
R: Bar chart from JSON
1. R: Bar chart from JSON
This page looks at two typical ways in which JSON data is represented.
List of lists of name-value pairs
List of dicts of name-value pairs
For each, an R program is provided to use that JSON data to create a bar chart.
The
rjson package is required.
2. Install R package rjson
R packages can be installed from R Studio or from the command line. Here is one way to install the R package
rjson from the Windows command line using the default Windows installation path for R.
"C:\Program Files\R\R-4.0.4\bin\Rscript.exe" -e "install.packages('rjson', repos='https://cran.rstudio.com/')"
The
repo parameter needs to be included and the single quotes need to be used inside the double quotes.
The path you use should include the installed version of R. The one here is
4.0.4.
3. Representing and processing count data
Here are links to the topic series of representing and processing data.
Summarizing book names and word count data
Ways to represent table data
R examples:
R: Bar chart from hard-coded data
R: Bar chart from CSV
R: Bar chart from JSON (this page)
R: Bar chart from XML
Python examples:
Python: Bar chart from text and CSV
Python: Bar chart from JSON
Python: Bar chart from XML
Python: Bar chart from CSV using Pandas
Python: Bar chart from JSON using Pandas
JavaScript and D3 examples:
JavaScript: SVG bar chart using D3
Julia examples:
Julia: Bar chart from JSON data using StatsPlots
... more to be added ...
Here is the JSON data to be read as a list of lists of name-value pairs.
[
["a",59900],
["b",11302],
["c",14311],
["d",34483],
["e",95247],
["f",17852],
["g",13528],
["h",62509],
["i",46347],
["j",2321],
["k",4449],
["l",25939],
["m",19154],
["n",51311],
["o",54741],
["p",9918],
["q",183],
["r",37468],
["s",44630],
["t",72396],
["u",20651],
["v",7458],
["w",18376],
["x",376],
["y",14814],
["z",234]
]
4. R code
Here is the R code [#1]
5. Code notes
The as.integer function is used to convert the Count field in dataFrame1 from character (as read from the data) to integer.
Whenever loading JSON using fromJson, the name file must be used. Otherwise, the parameter will be interpreted as JSON text and not a JSON file from which to load the text.
... more to be added ...
6. R output
Here is the output of the R code.
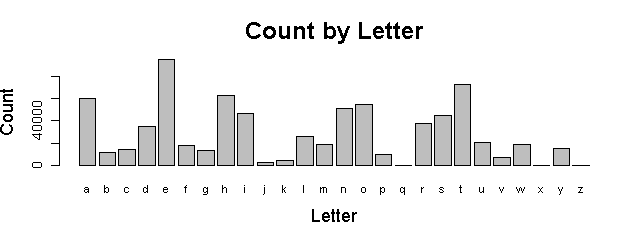
7. R chart
This is a simple bar chart for the present purposes. Future topics will cover how to make it look nicer.
Here is the chart produced by the R code.
Here is the JSON data to be read as a list of dicts (i.e., dictionaries) with name-value pairs.
[
{"name":"a", "value":59900},
{"name":"b", "value":11302},
{"name":"c", "value":14311},
{"name":"d", "value":34483},
{"name":"e", "value":95247},
{"name":"f", "value":17852},
{"name":"g", "value":13528},
{"name":"h", "value":62509},
{"name":"i", "value":46347},
{"name":"j", "value":2321},
{"name":"k", "value":4449},
{"name":"l", "value":25939},
{"name":"m", "value":19154},
{"name":"n", "value":51311},
{"name":"o", "value":54741},
{"name":"p", "value":9918},
{"name":"q", "value":183},
{"name":"r", "value":37468},
{"name":"s", "value":44630},
{"name":"t", "value":72396},
{"name":"u", "value":20651},
{"name":"v", "value":7458},
{"name":"w", "value":18376},
{"name":"x", "value":376},
{"name":"y", "value":14814},
{"name":"z", "value":234}
]
8. R code
Here is the R code [#2]
9. Code notes
The as.integer function is used to convert the Count field in dataFrame1 from character (as read from the data) to integer.
Whenever loading JSON using fromJson, the name file must be used. Otherwise, the parameter will be interpreted as JSON text and not a JSON file from which to load the text.
... more to be added ...
10. R output
Here is the output of the R code.
11. R chart
This is a simple bar chart for the present purposes. Future topics will cover how to make it look nicer.
Here is the chart produced by the R code.
12. End of page