Send
Close Add comments:
(status displays here)
Got it! This site "www.robinsnyder.com" uses cookies. You consent to this by clicking on "Got it!" or by continuing to use this website. Note: This appears on each machine/browser from which this site is accessed.
Python: Bar chart from XML
1. Python: Bar chart from XML
This page shows how to use Lua to read in the data names with counts from XML text files and make a simple bar chart.
2. Representing and processing count data
3. Imports used
The ElementTree library is needed.
An abbreviation is often used for imported libraries. In this case, the abbreviation et is used.
4. XML nodes with attributes
Here is one typical form of XML data using nodes with attributes.
<table>
<record name="a" value="59900"/>
<record name="b" value="11302"/>
<record name="c" value="14311"/>
<record name="d" value="34483"/>
<record name="e" value="95247"/>
<record name="f" value="17852"/>
<record name="g" value="13528"/>
<record name="h" value="62509"/>
<record name="i" value="46347"/>
<record name="j" value="2321"/>
<record name="k" value="4449"/>
<record name="l" value="25939"/>
<record name="m" value="19154"/>
<record name="n" value="51311"/>
<record name="o" value="54741"/>
<record name="p" value="9918"/>
<record name="q" value="183"/>
<record name="r" value="37468"/>
<record name="s" value="44630"/>
<record name="t" value="72396"/>
<record name="u" value="20651"/>
<record name="v" value="7458"/>
<record name="w" value="18376"/>
<record name="x" value="376"/>
<record name="y" value="14814"/>
<record name="z" value="234"/>
</table>
5. Program code
Here is the Python code [#2]
6. Output
Here is the output of the Python code.
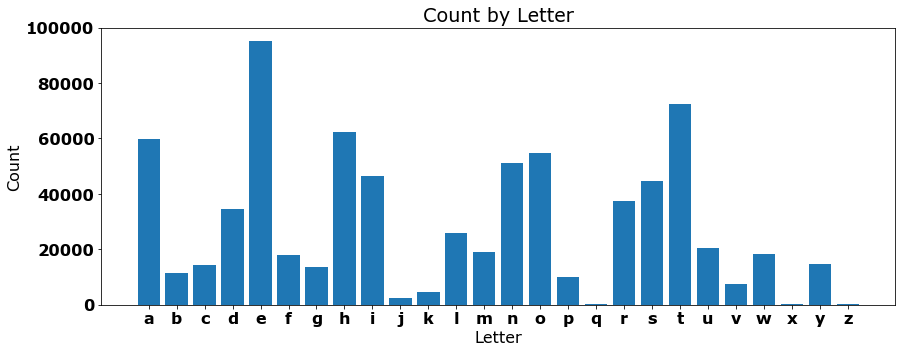
7. Chart
This is a simple bar chart for the present purposes. Future topics will cover how to make it look nicer.

8. XML nodes with text
Here is another typical form of XML data using nodes with nodes with text.
<table>
<record><name>a</name><value>59900</value></record>
<record><name>b</name><value>11302</value></record>
<record><name>c</name><value>14311</value></record>
<record><name>d</name><value>34483</value></record>
<record><name>e</name><value>95247</value></record>
<record><name>f</name><value>17852</value></record>
<record><name>g</name><value>13528</value></record>
<record><name>h</name><value>62509</value></record>
<record><name>i</name><value>46347</value></record>
<record><name>j</name><value>2321</value></record>
<record><name>k</name><value>4449</value></record>
<record><name>l</name><value>25939</value></record>
<record><name>m</name><value>19154</value></record>
<record><name>n</name><value>51311</value></record>
<record><name>o</name><value>54741</value></record>
<record><name>p</name><value>9918</value></record>
<record><name>q</name><value>183</value></record>
<record><name>r</name><value>37468</value></record>
<record><name>s</name><value>44630</value></record>
<record><name>t</name><value>72396</value></record>
<record><name>u</name><value>20651</value></record>
<record><name>v</name><value>7458</value></record>
<record><name>w</name><value>18376</value></record>
<record><name>x</name><value>376</value></record>
<record><name>y</name><value>14814</value></record>
<record><name>z</name><value>234</value></record>
</table>
9. Program code
Here is the Python code [#3]
10. Output
Here is the output of the Python code.
11. Chart
This is a simple bar chart for the present purposes. Future topics will cover how to make it look nicer.
12. End of page