Send
Close Add comments:
(status displays here)
Got it! This site "www.robinsnyder.com" uses cookies. You consent to this by clicking on "Got it!" or by continuing to use this website. Note: This appears on each machine/browser from which this site is accessed.
Python: Bar chart from text and CSV
1. Python: Bar chart from text and CSV
This page shows how to use Python to read and parse text and CSV data with names and counts and make a simple bar chart.
2. Representing and processing count data
3. Text data
Here is the text data to be read.
a:59900
b:11302
c:14311
d:34483
e:95247
f:17852
g:13528
h:62509
i:46347
j:2321
k:4449
l:25939
m:19154
n:51311
o:54741
p:9918
q:183
r:37468
s:44630
t:72396
u:20651
v:7458
w:18376
x:376
y:14814
z:234
The delimiter is the colon character "
:".
4. Parameters
Some required parameters can be assigned as variables.
Some others are omitted. Defaults used.
5. Read and process text
To text is read from a file as text.
6. Process text
The text is processed to split and output.
Note the conversion of count1 from string to integer.
7. Complete program
Here is the Python code [#4]
8. Output
Here is the output of the Python code.
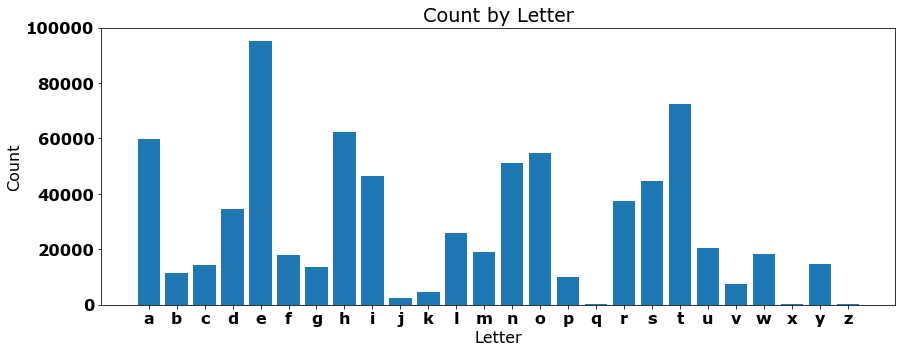
9. Chart
This is a simple bar chart for the present purposes. Future topics will cover how to make it look nicer.
10. CSV data
Here is the CSV data to be read.
a,59900
b,11302
c,14311
d,34483
e,95247
f,17852
g,13528
h,62509
i,46347
j,2321
k,4449
l,25939
m,19154
n,51311
o,54741
p,9918
q,183
r,37468
s,44630
t,72396
u,20651
v,7458
w,18376
x,376
y,14814
z,234
Whenever custom handling of CSV files is required, a language such as Python can be used.
The
csv module is required.
11. Parameters
Some required parameters can be assigned as variables.
Some others are omitted. Defaults used.
12. Read CSV
The csv file is read and processing using the csv module. This is preferred as the delimiters, quotes, etc., are handled automatically.
In this case, the complete table is forced (eager evaluation) so that the file can be closed and processing done elsewhere.
13. Process CSV
The CSV file that has been read can now be read as a 2D table - a list of lists of values.
Note the conversion of count1 from string to integer.
14. Complete program
Here is the Python code [#9]
15. Output
Here is the output of the Python code.
16. Chart
This is a simple bar chart for the present purposes. Future topics will cover how to make it look nicer.

17. CSV as text
Note that csv files are stored and read as text. When it is important that certain data be numeric fields, explicit conversion is necessary.
18. End of page