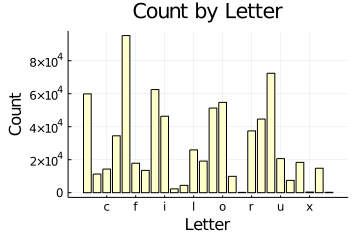
This page shows one way to use Julia and the StatsPlots package(s) to create a simple bar chart.
Julia packages can be installed from REPL loop or from the command line. Here is one way to install the Julia package(s)
StatsPlots from the Windows command line.
"D:\E\julia-1.5.3\bin\julie.exe" -e "using Pkg; Pkg.add(\"StatsPlots\")"
The backslash quotes in the quoted text are important. The path you use should include the installed version of Julia. The one here is
D:\E\julia-1.5.3\bin. Julia installs any needed dependencies, so the installation could take a while.
From the REPL command line, the following can be used (right square bracket followed by command).
] add StatsPlots
Julia packages can be installed from REPL loop or from the command line. Here is one way to install the Julia package(s)
JSON from the Windows command line.
"D:\E\julia-1.5.3\bin\julie.exe" -e "using Pkg; Pkg.add(\"JSON\")"
The backslash quotes in the quoted text are important. The path you use should include the installed version of Julia. The one here is
D:\E\julia-1.5.3\bin. Julia installs any needed dependencies, so the installation could take a while.
From the REPL command line, the following can be used (right square bracket followed by command).
] add JSON
Here is one possible JSON way to represent data as a list of lists.
[
["a",59900],
["b",11302],
["c",14311],
["d",34483],
["e",95247],
["f",17852],
["g",13528],
["h",62509],
["i",46347],
["j",2321],
["k",4449],
["l",25939],
["m",19154],
["n",51311],
["o",54741],
["p",9918],
["q",183],
["r",37468],
["s",44630],
["t",72396],
["u",20651],
["v",7458],
["w",18376],
["x",376],
["y",14814],
["z",234]
]
Here is the Julia code to read the above JSON data file and output the results.
Here is the Julia code [#1]
Here is the output of the Julia code.