Send
Close Add comments:
(status displays here)
Got it! This site "www.robinsnyder.com" uses cookies. You consent to this by clicking on "Got it!" or by continuing to use this website. Note: This appears on each machine/browser from which this site is accessed.
R: Bar chart from CSV
1. R: Bar chart from CSV
This page looks at using CSV data.
An R program is provided to use that CSV data to create a bar chart.
2. Representing and processing count data
Here are links to the topic series of representing and processing data.
Summarizing book names and word count data
Ways to represent table data
R examples:
R: Bar chart from hard-coded data
R: Bar chart from CSV (this page)
R: Bar chart from JSON
R: Bar chart from XML
Python examples:
Python: Bar chart from text and CSV
Python: Bar chart from JSON
Python: Bar chart from XML
Python: Bar chart from CSV using Pandas
Python: Bar chart from JSON using Pandas
JavaScript and D3 examples:
JavaScript: SVG bar chart using D3
Julia examples:
Julia: Bar chart from JSON data using StatsPlots
... more to be added ...
Here is the CSV data to be read.
a,59900
b,11302
c,14311
d,34483
e,95247
f,17852
g,13528
h,62509
i,46347
j,2321
k,4449
l,25939
m,19154
n,51311
o,54741
p,9918
q,183
r,37468
s,44630
t,72396
u,20651
v,7458
w,18376
x,376
y,14814
z,234
3. R code
Here is the R code [#1]
4. Code notes
The as.integer function is used to convert the Count field in dataFrame1 from character (as read from the data) to integer.
... more to be added ...
5. R output
Here is the output of the R code.
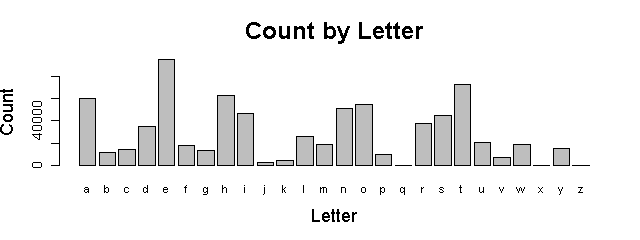
6. R chart
This is a simple bar chart for the present purposes. Future topics will cover how to make it look nicer.
Here is the chart produced by the R code.
7. End of page