Send
Close Add comments:
(status displays here)
Got it! This site "www.robinsnyder.com" uses cookies. You consent to this by clicking on "Got it!" or by continuing to use this website. Note: This appears on each machine/browser from which this site is accessed.
R: Bar chart from hard-coded data
1. R: Bar chart from hard-coded data
This page looks at using hard-coded data.
An R program is provided to use that hard-coded data to create a bar chart.
2. Representing and processing count data
3. R code
Here is the R code [#1]
4. Code notes
... more to be added ...
5. R output
Here is the output of the R code.
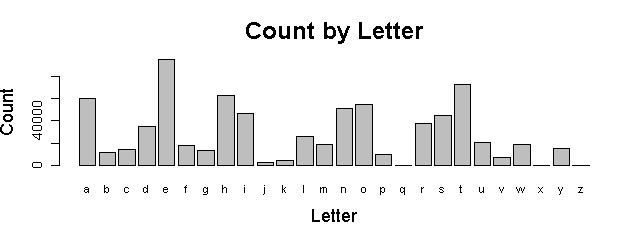
6. R chart
This is a simple bar chart for the present purposes. Future topics will cover how to make it look nicer.
Here is the chart produced by the R code.
7. End of page