Send
Close Add comments:
(status displays here)
Got it! This site "www.robinsnyder.com" uses cookies. You consent to this by clicking on "Got it!" or by continuing to use this website. Note: This appears on each machine/browser from which this site is accessed.
Python: Bar chart from JSON using Pandas
1. Python: Bar chart from JSON using Pandas
This page looks at using Pandas to read JSON data and create a simple bar chart.
2. Pandas
Pandas for Python will be used.
Pandas will try to make sense of the JSON using several ways so that, in this case, the variations of JSON data used do not need changes in the way that the Pandas calls are made.
This is unlike using just Python where the differences in the JSON require different code statements.
... more to be added ...
3. Data orientations
To types of data orientations supported by Pandas include the following
Index: dict of row dicts or list of row dicts
Values: list of lists
Columns: dict of column dicts (not used here)
4. Representing and processing count data
5. JSON data
Here is the JSON data to be read as a list of lists.
[
["a",59900],
["b",11302],
["c",14311],
["d",34483],
["e",95247],
["f",17852],
["g",13528],
["h",62509],
["i",46347],
["j",2321],
["k",4449],
["l",25939],
["m",19154],
["n",51311],
["o",54741],
["p",9918],
["q",183],
["r",37468],
["s",44630],
["t",72396],
["u",20651],
["v",7458],
["w",18376],
["x",376],
["y",14814],
["z",234]
]
6. Python code using Pandas
Here is the Python code [#1]
7. Output
Here is the output of the Python code.
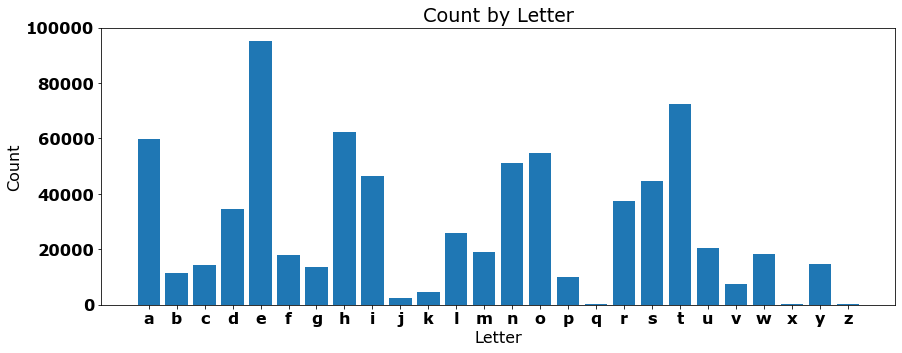
8. Chart
This is a simple bar chart for the present purposes. Future topics will cover how to make it look nicer.

9. JSON data
Here is the JSON data to be read as a list of dicts.
[
{"name":"a", "value":59900},
{"name":"b", "value":11302},
{"name":"c", "value":14311},
{"name":"d", "value":34483},
{"name":"e", "value":95247},
{"name":"f", "value":17852},
{"name":"g", "value":13528},
{"name":"h", "value":62509},
{"name":"i", "value":46347},
{"name":"j", "value":2321},
{"name":"k", "value":4449},
{"name":"l", "value":25939},
{"name":"m", "value":19154},
{"name":"n", "value":51311},
{"name":"o", "value":54741},
{"name":"p", "value":9918},
{"name":"q", "value":183},
{"name":"r", "value":37468},
{"name":"s", "value":44630},
{"name":"t", "value":72396},
{"name":"u", "value":20651},
{"name":"v", "value":7458},
{"name":"w", "value":18376},
{"name":"x", "value":376},
{"name":"y", "value":14814},
{"name":"z", "value":234}
]
10. Python code using Pandas
Here is the Python code [#2]
11. Output
Here is the output of the Python code.
12. Chart
This is a simple bar chart for the present purposes. Future topics will cover how to make it look nicer.
13. End of page