Send
Close Add comments:
(status displays here)
Got it! This site "www.robinsnyder.com" uses cookies. You consent to this by clicking on "Got it!" or by continuing to use this website. Note: This appears on each machine/browser from which this site is accessed.
Python: Bar chart from CSV using Pandas
1. Representing and processing count data
2. CSV data
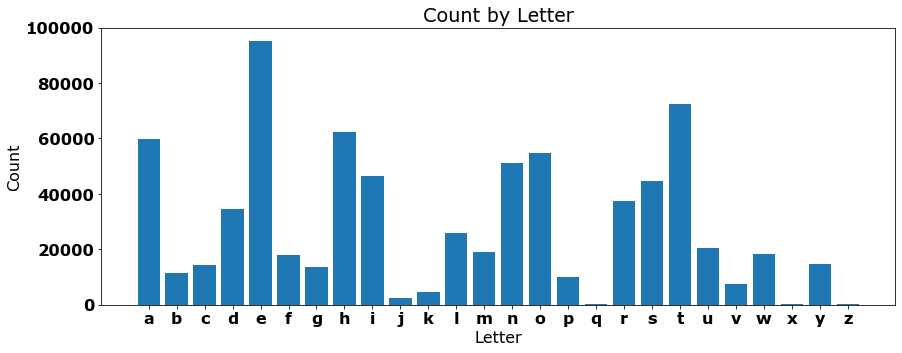
Here is the CSV data to be read.
a,59900
b,11302
c,14311
d,34483
e,95247
f,17852
g,13528
h,62509
i,46347
j,2321
k,4449
l,25939
m,19154
n,51311
o,54741
p,9918
q,183
r,37468
s,44630
t,72396
u,20651
v,7458
w,18376
x,376
y,14814
z,234
3. Python code using Pandas
Here is the Python code [#1]
4. Output
Here is the output of the Python code.
5. Chart
This is a simple bar chart for the present purposes. Future topics will cover how to make it look nicer.
6. End of page